Adapting to climate change in the Italian Alps
Marco Buemi
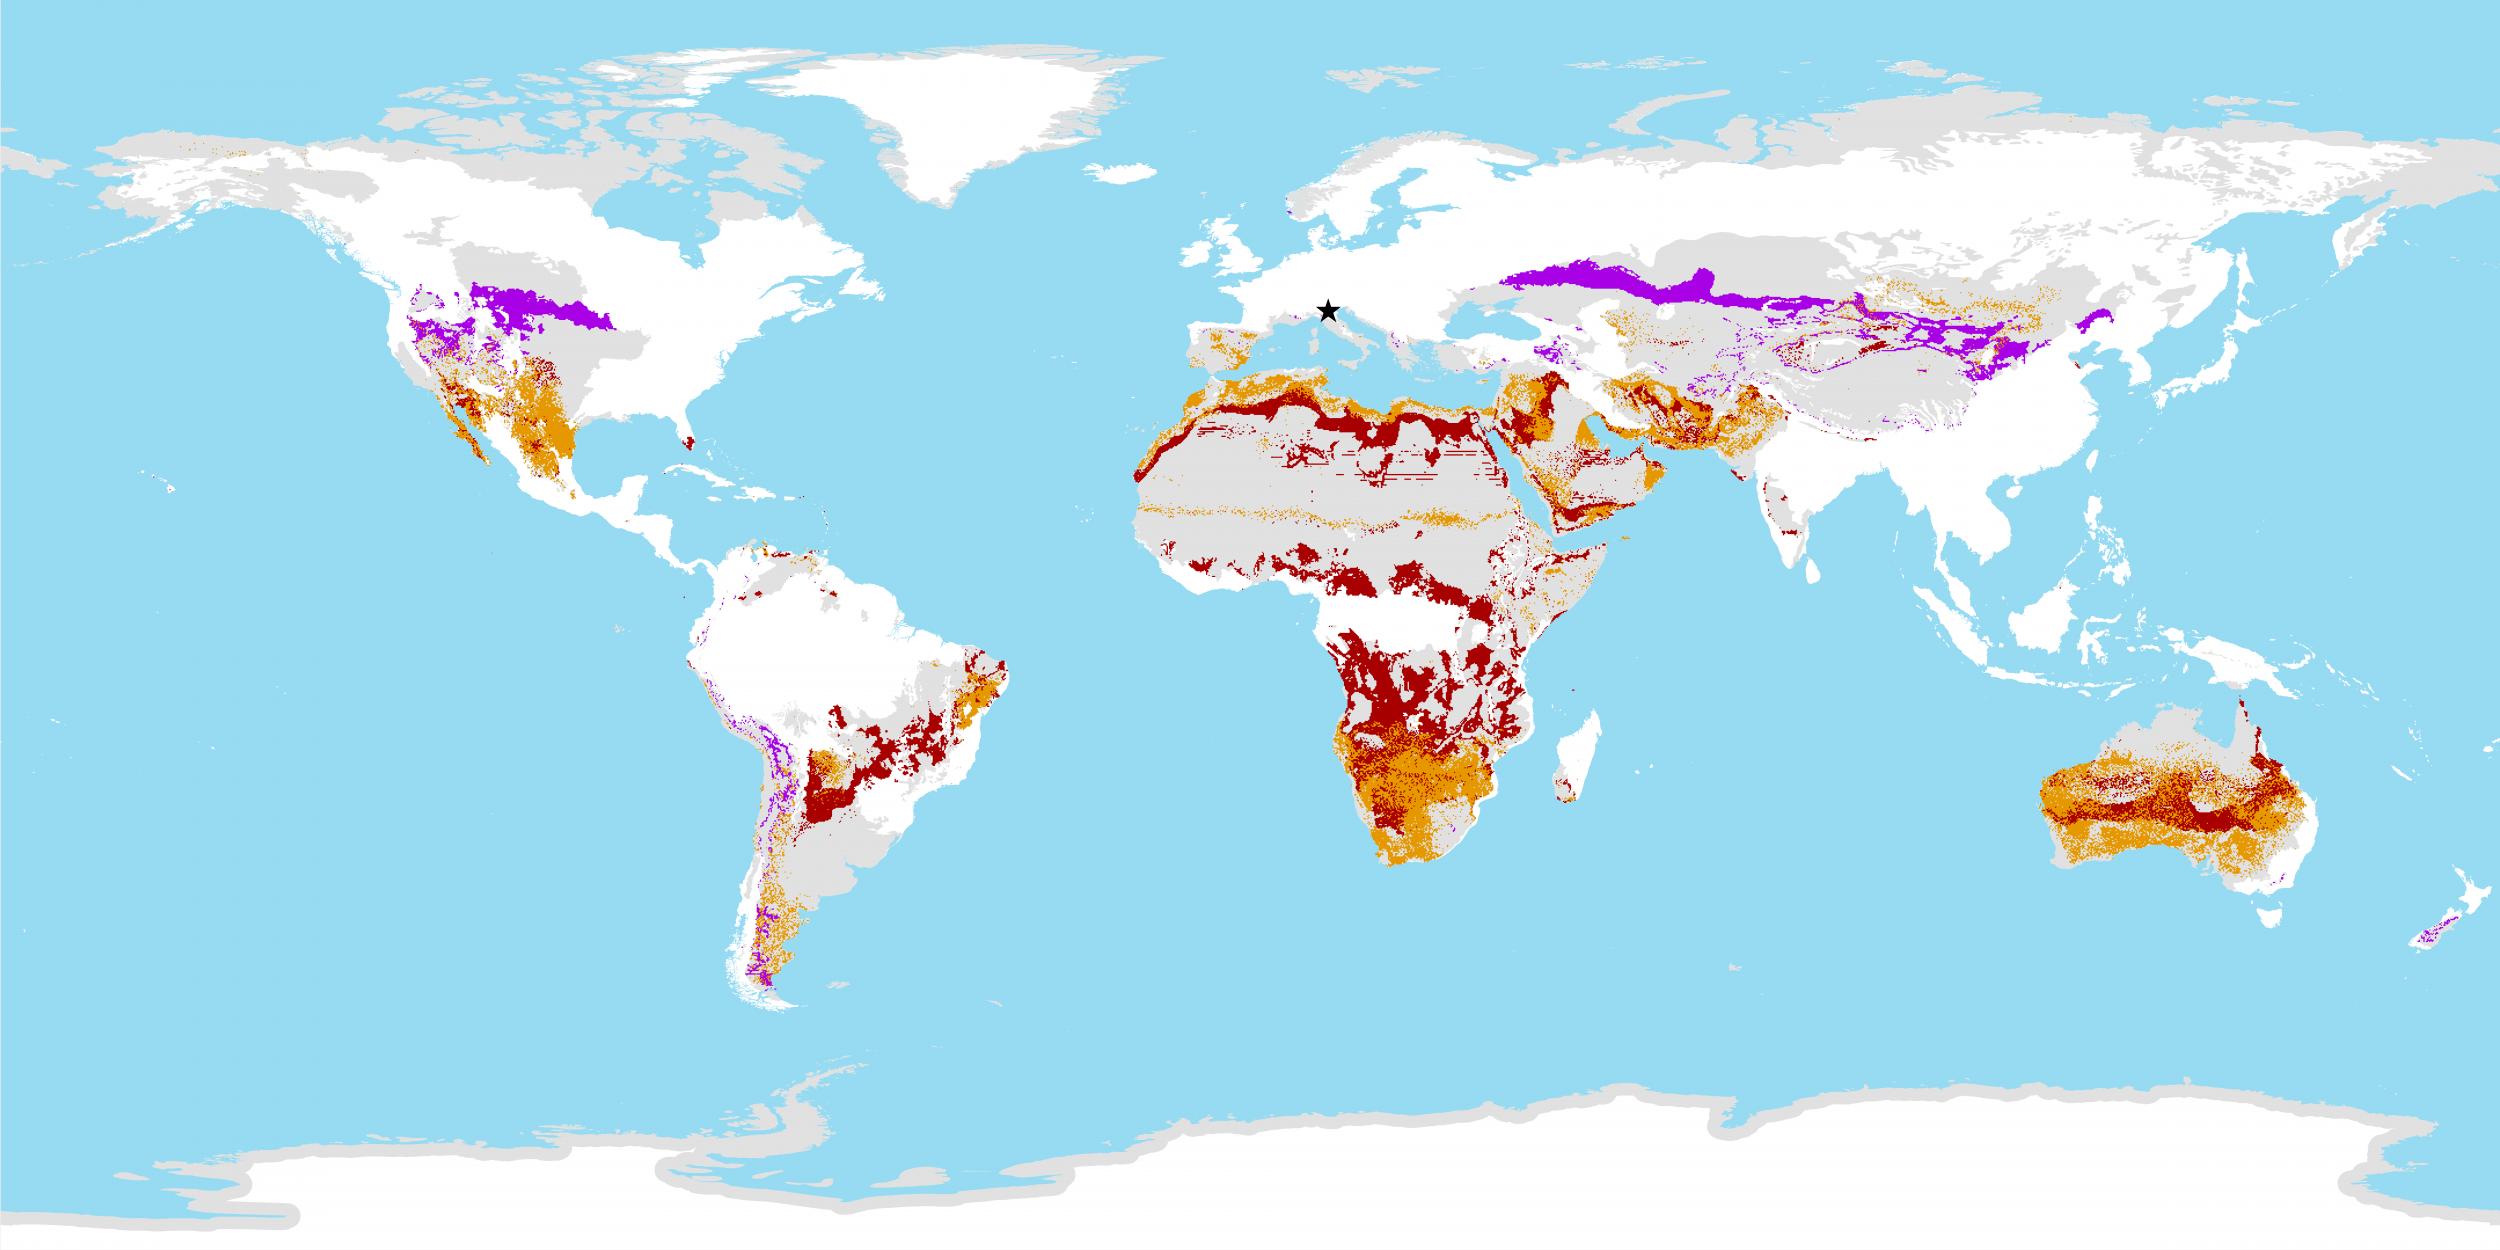
The Alps have been identified as one of the most vulnerable areas to climate change in Europe. Over the last century, global warming has caused all Alpine glaciers in Europe to recede as well as triggered changes in rain and snowfall patterns shortening snow seasons and causing glaciers to recede. Snowmelt is predicted at 10,000 feet by the end of the century.
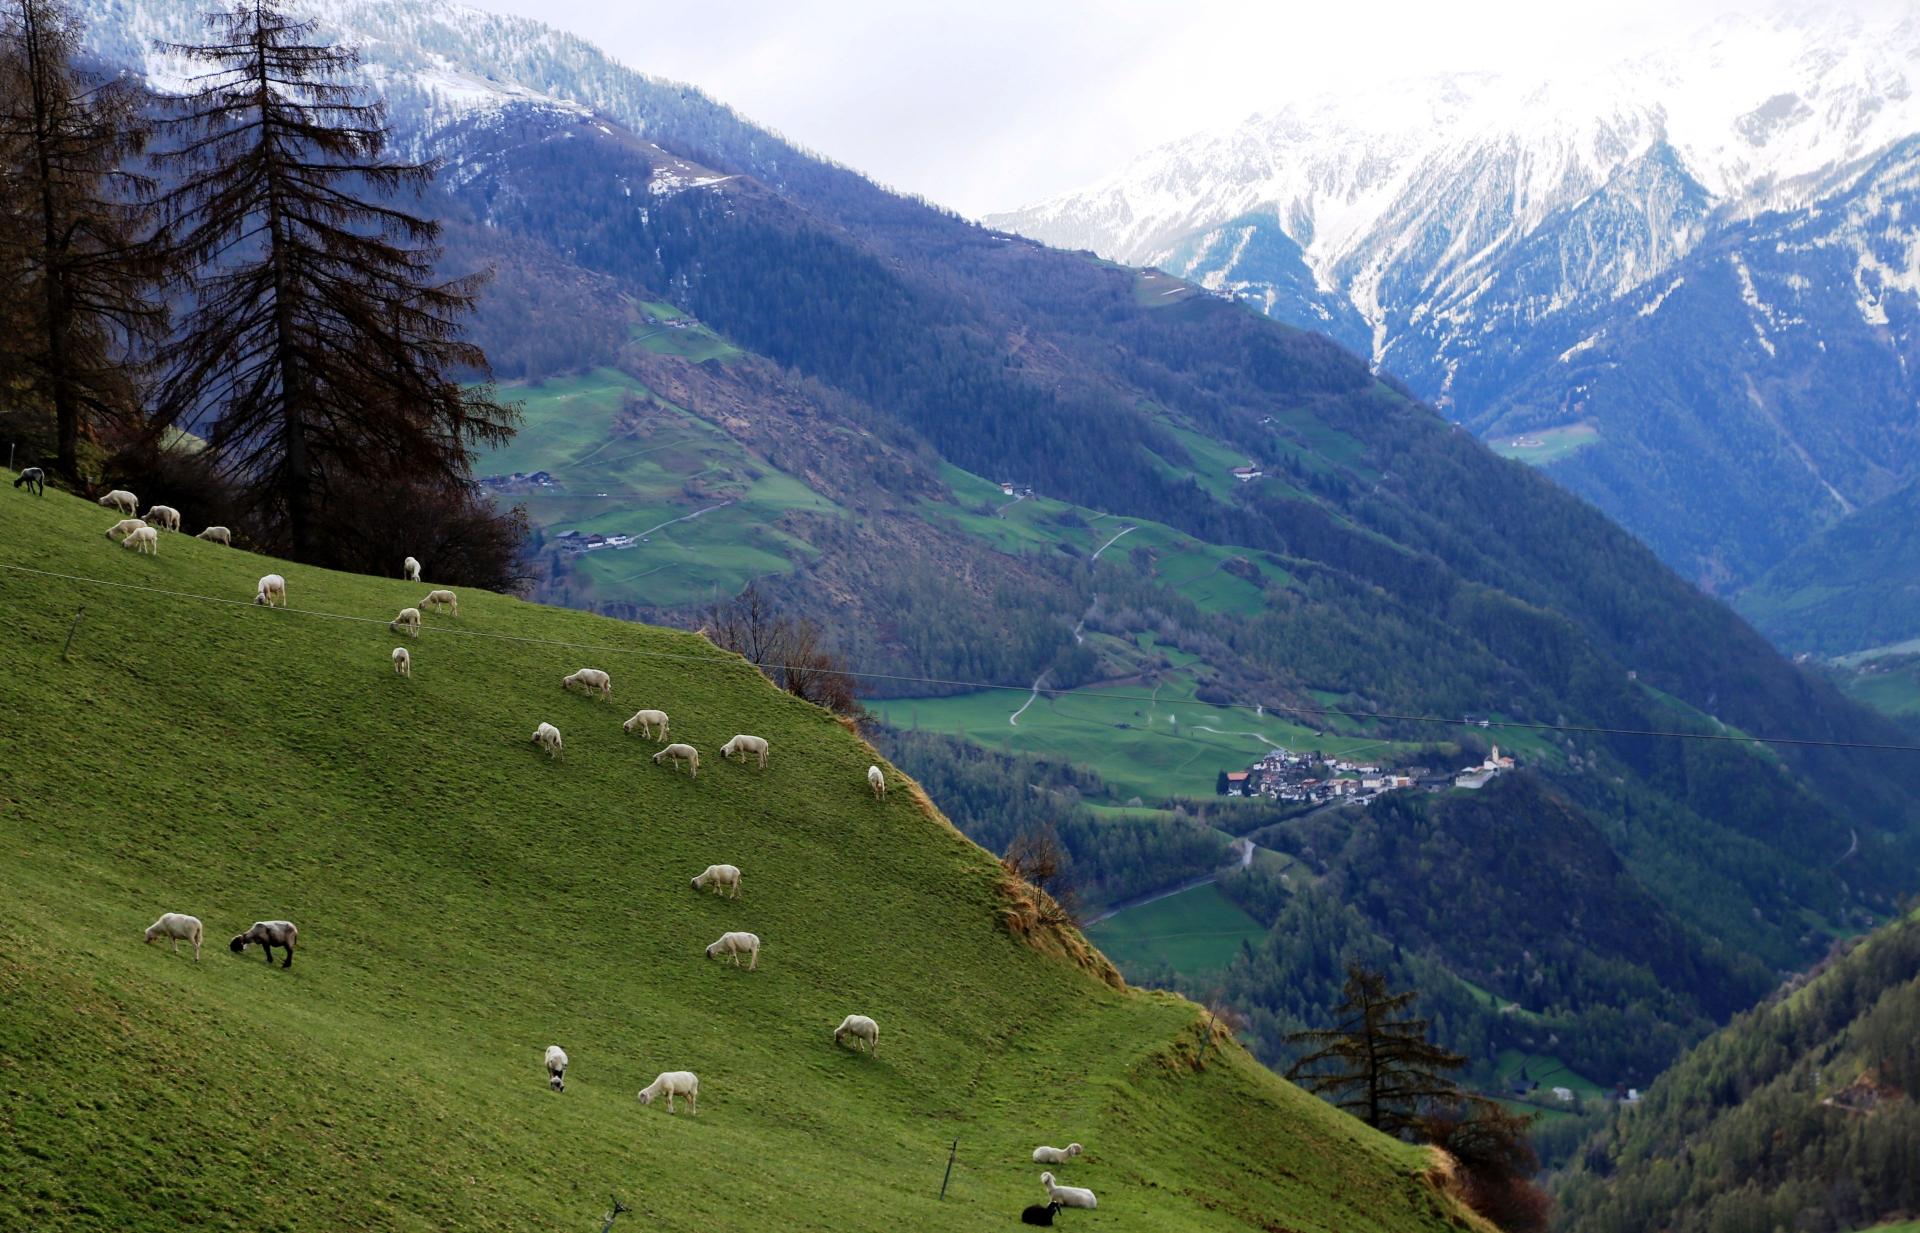
The province of Trento is found in the southern Alps of northern Italy. Here it is common to find dairy cattle breeding, including the Bruna Italiana or Bruna alpina - a hardy breed that has adapted well to mountain pastures, as well as sheep and goat farming.
Cattle breeders practice transhumance, herding the animals up into the mountains during the summer from June until their return in September. Above 1,600 m, the pastures are held in common and governed by user rights, or usicivici. A pasture management committee in each village defines the usage rules of the mountain pastures avoiding conflict and making optimal use of the common pastures.
Sheep and goats are taken on longer transhumance, following ancient well-trodden routes over the mountains. One of the first Alpine transhumance routes is found in Südtirol and is now protected under UNESCO as Intangible Cultural Heritage. The route has been used for over 10,000 years, with some sections known to have been used for 40,000 years. Shepherd’s associations manage the transhumance according to suitable weather conditions, which are increasingly unpredictable.
In the Schnalstal Valley the local association has been chaired by bauer Joseph Götsch of Gurschlerhof since 2005. Every year he and his family organise the outward and return transhumance of thousands of sheep to summer pastures in neighbouring Austria, to which the community hold an ancient right. Since the Middle Ages, these rights and associated events have been documented including climatic events such as the little ice age noted in 1599 as causing a new glacier to form preventing further transhumance of cattle. Today, warmer temperatures and drier summers have meant that farmers and breeders need to irrigate their pastures, and sudden and sometimes violent atmospheric variations cause problems for the transhumance. For the communities reliant on livestock in these areas, future climate change is a significant concern.
For further information, see https://www.merano-suedtirol.it/it/val-senales/natura-cultura/il-territorio-le-persone/transumanza.html
At the European level, an Alpine Convention has been established to address the problem as a coordinated response. In 2014, guidelines for climate change adaptation were developed; see here: https://www.minambiente.it/sites/default/files/archivio_immagini/Lima/Guidelines%20for%20Climate%20Change%20Adaptation%20at%20the%20local%20level%20in%20the%20Alps_.pdf
For more information on pastoralism in Europe see:
Mobility and Migration in Mediterranean Europe: https://link.springer.com/chapter/10.1007/978-3-030-42863-1_3
Roads Less Travelled Initiative: https://roads-less-travelled.org
Mobile Pastoralism in Mediterranean Landscapes: https://yolda.org.tr/content/MP-in-Med-Landspaces.pdf
Euro Montana, the European Association of Mountain Areas: https://www.euromontana.org
Sustainable Management of Mountain Grasslands http://www.lifeorekamendian.eu/wp-content/uploads/2021/04/GPbooklet_EN2.pdf
Projections to 2015 were made using a high-emissions scenario (RCP8.5) developed by the Intergovernmental Panel on Climate Change and data form an ensemble of 17 climate models taken from the fifth phase of the Coupled Model Intercomparison Project (CMIP5) of the World Climate Research Program.