
An agrosilvopastoral system in southern Spain – the case of the “dehesa”
Marco Buemi
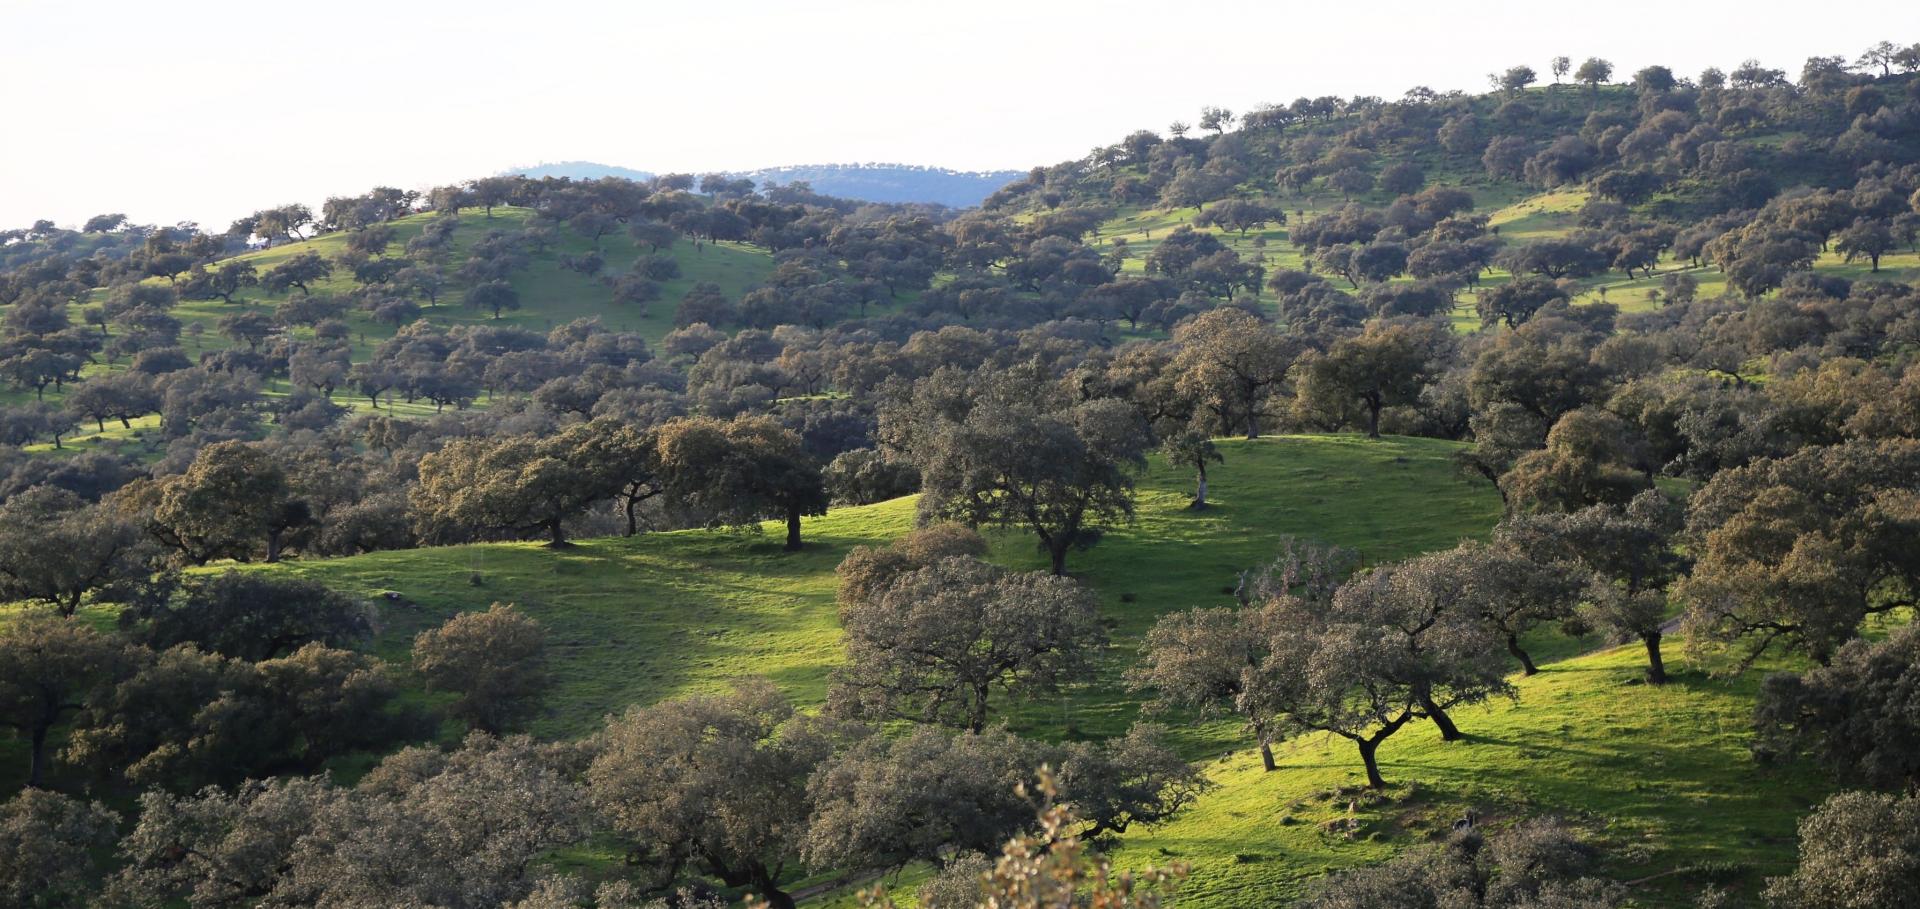
“Dehesa” is a multi-functional agrosilvopastoral system, occupying around 2.3 million hectares in central and southern Spain and 0.7 million hectares in southern Portugal. It is known as “montado” in Portugal. This unique landscape is a result, in part, from the clearance of Mediterranean forests and shrublands, where tree and shrub cover were reduced in favour of farming and grasslands for grazing.
Dehesa are characterised by the rearing of traditional livestock breeds at low densities and careful exploitation of evergreen oaks for acorns (eaten by pigs) and cork (still highly lucrative). Dehesas are among the best preserved, low-intensity farming systems in Europe, wherein the integration of traditional land use and biodiversity conservation is considered exemplary land use management. In Spain, these landscapes are most common across the Andalucia region.
Women play a key role in the preservation and management of these agrisilvopastoral systems, with several extensive dehesas being led by them. They often combine the management and income-generation from the land with agri-tourism, conservation activities, training centers and other initiatives.
One such example is the Fundación Monte Mediterráneo and the Dehesa San Francisco, which was founded by Hans-Gerd Neglein but is run by his wife, Ernestine Lüdeke. Together, their goal is to help the dehesa be the “last frontier to the desert,” hosting as many species of plants and animals as possible. Organic and sustainable management with a variety in livestock husbandry is combined with careful forestry and wildlife-enhancing activities. This work includes marketing the products and carrying out research programmes. Ernestine and her colleagues are also involved in advocacy and lobbying work, promoting the dehesa and pastoralism in Spain and in Europe, including organising publicity around the annual moving of livestock to summer pastures in the mountains of northern Spain.
For more information:
Dehesa Farms in Spain: https://www.agforward.eu/index.php/en/dehesa-farms-in-spain.html
Fundación Monte Mediterráneo and the Dehesa San Francisco: https://www.fundacionmontemediterraneo.com/gb/
Deforestation Fronts: Drivers and responses in a changing world: https://wwfint.awsassets.panda.org/downloads/deforestation_fronts___drivers_and_responses_in_a_changing_world___full_report_1.pdf and (earth engine partners under terminology) https://earthenginepartners.appspot.com/science-2013-global-forest/down…
Terminologies used
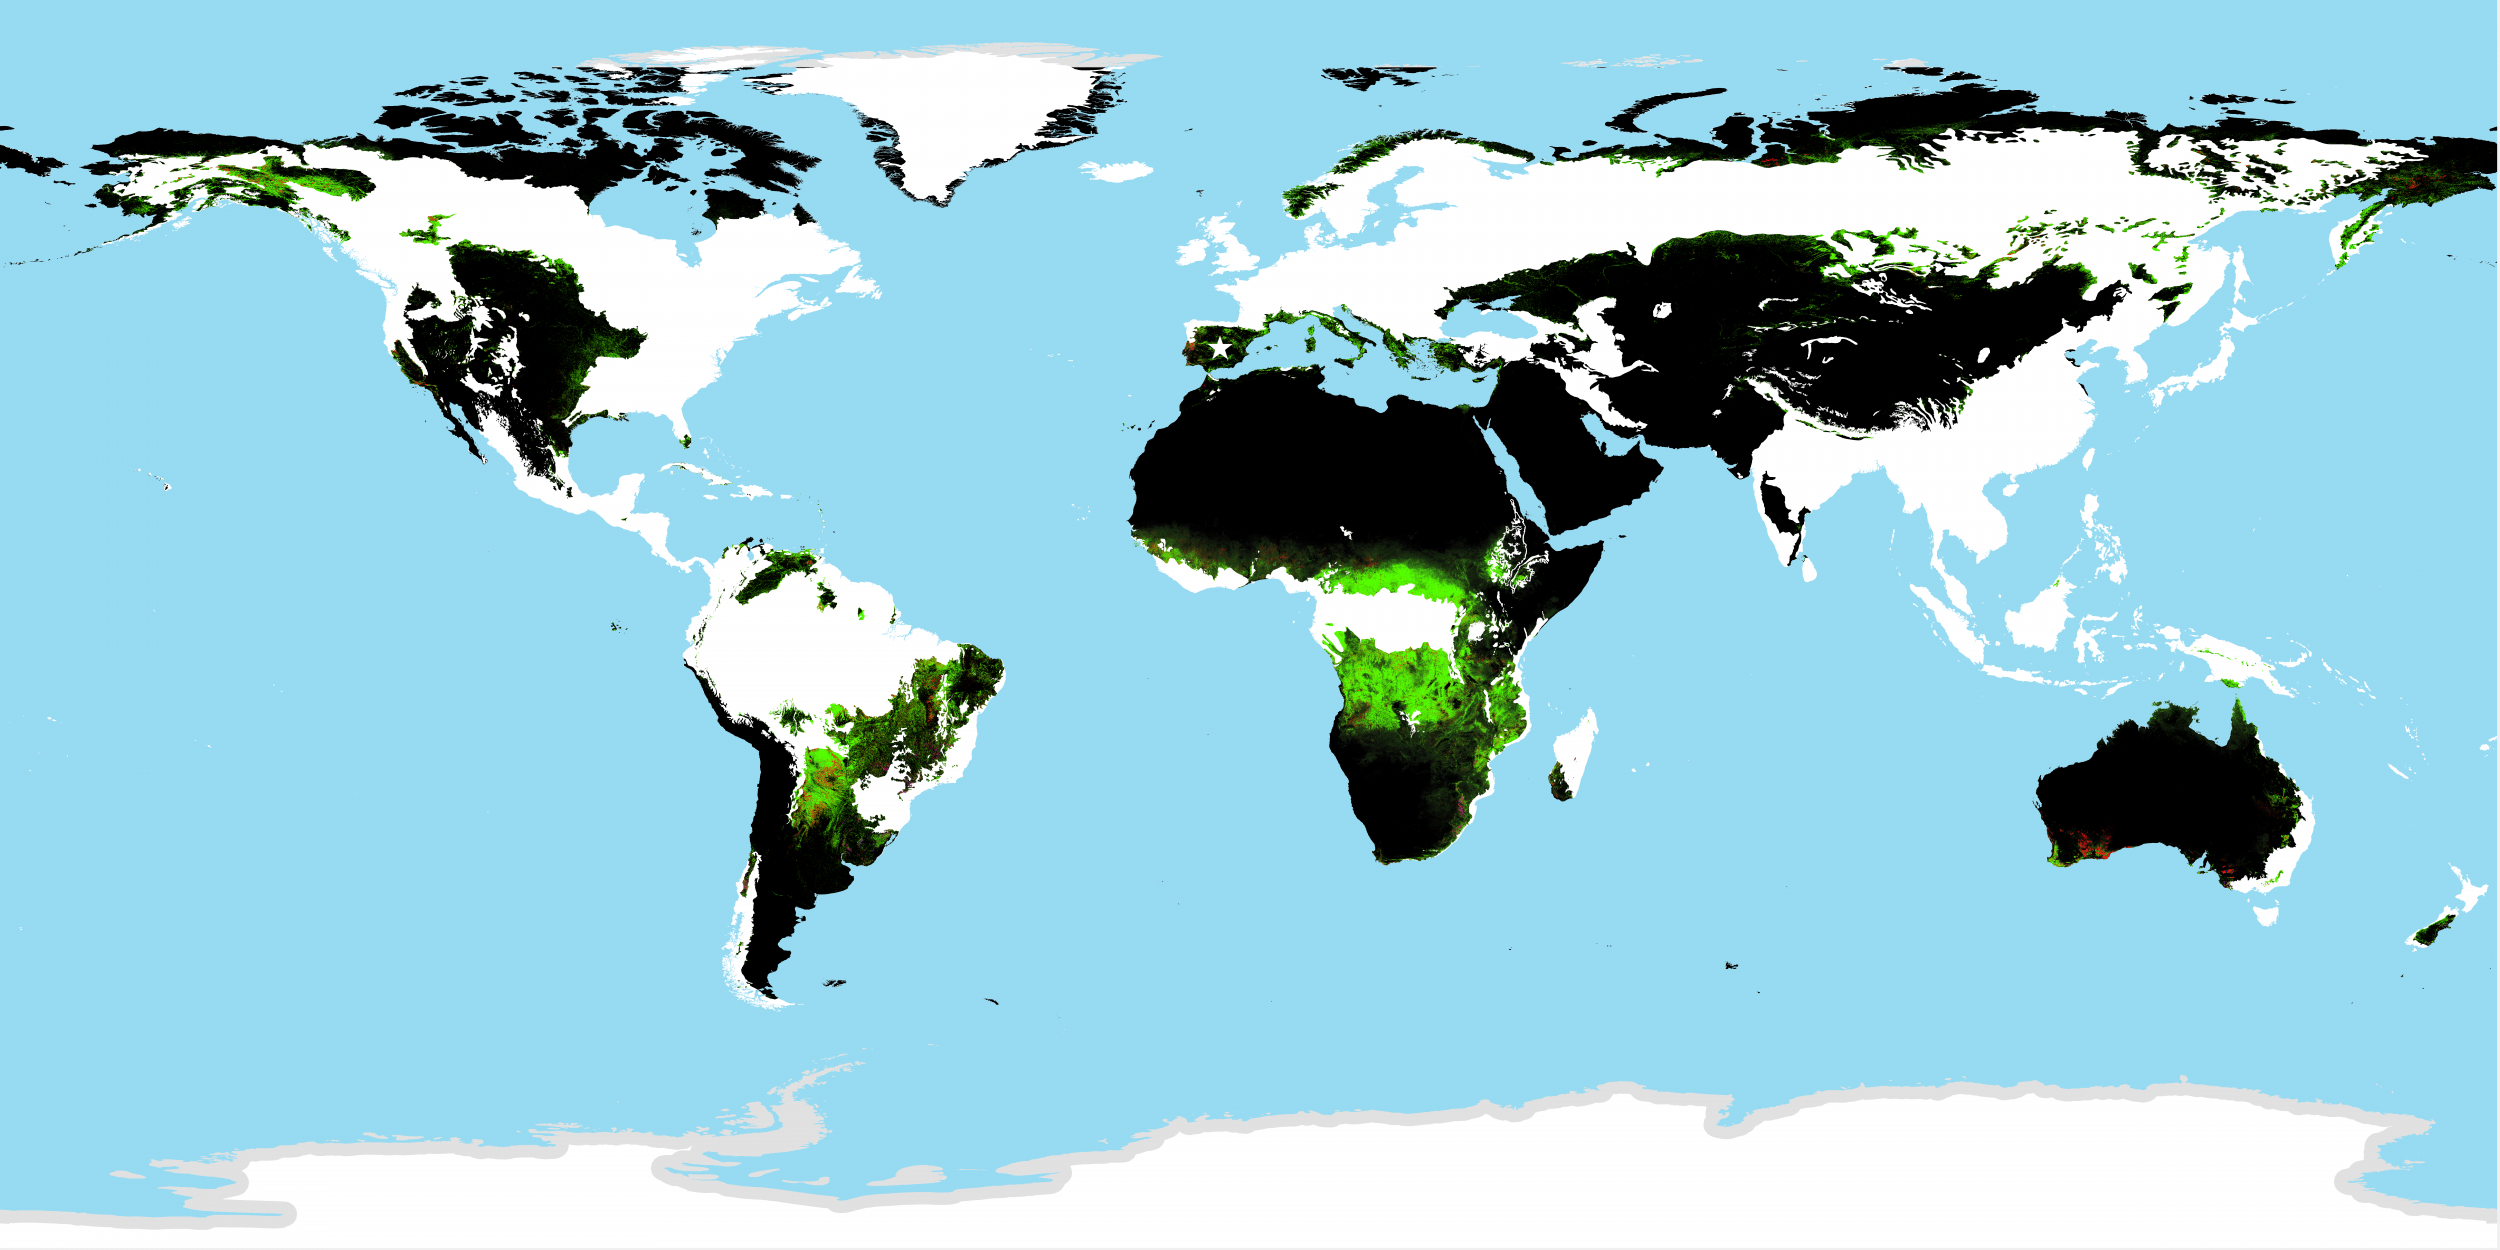
Map1 Gain and Loss: A color composite of tree cover in green, forest loss in red, forest gain in blue.
Map2 Gain: Defined as non-forest to forest change entirely within the study period.
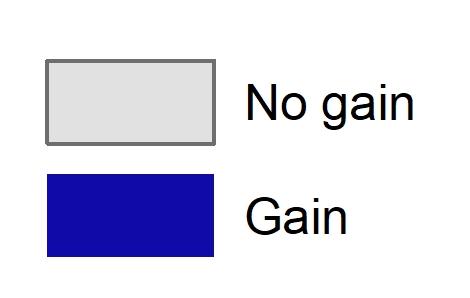
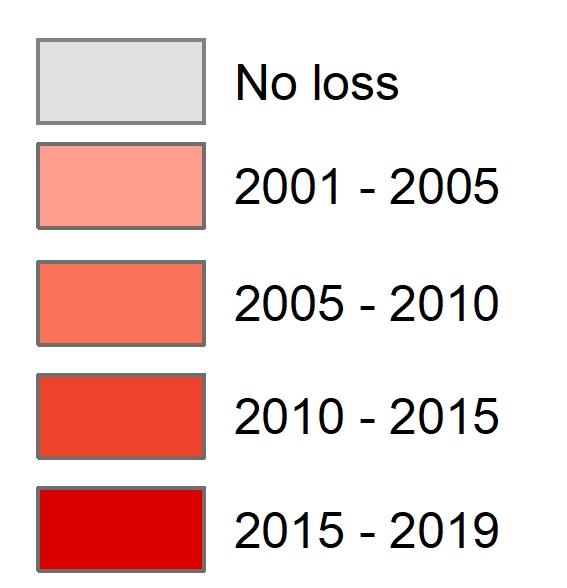
Map3 Loss: Defined as a stand-replacement disturbance, or a change from a forest to non-forest state.
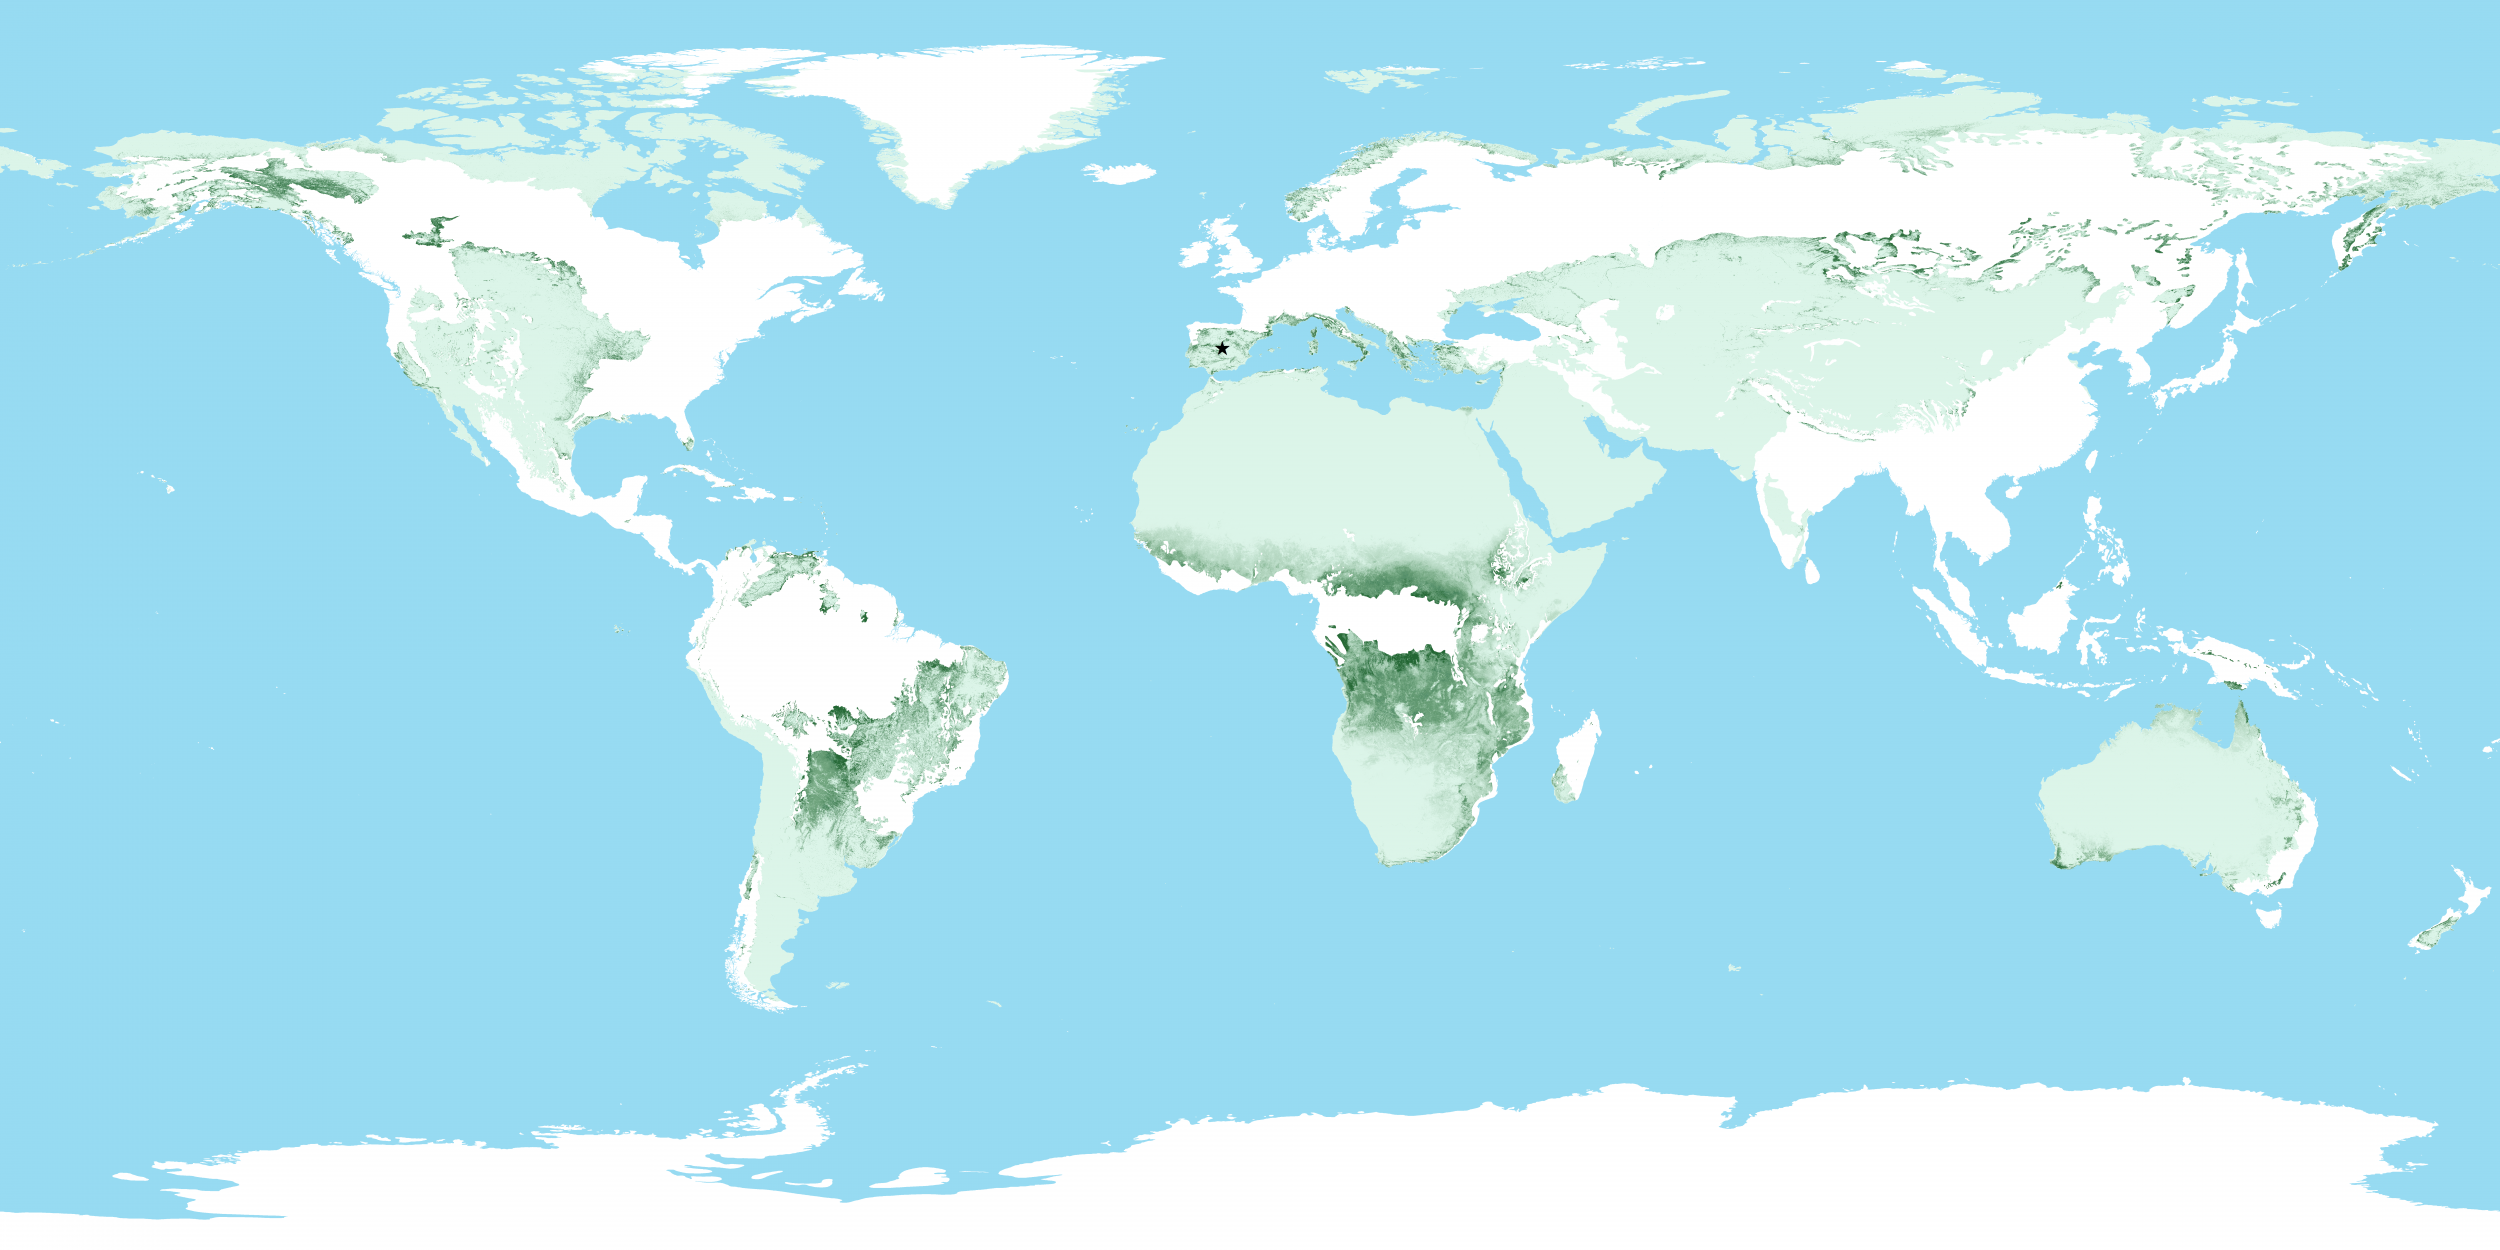
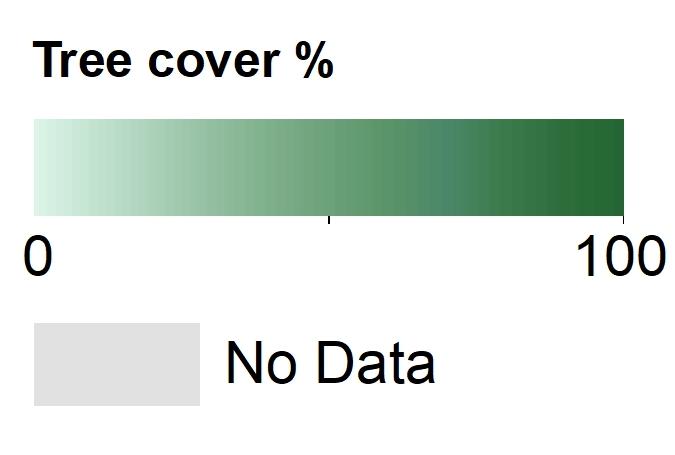
Map4 TreeCover2000: Tree cover in the year 2000, defined as canopy closure for all vegetation taller than 5m in height. Encoded as a percentage per output grid cell, in the range 0–100.
Results from time-series analysis of Landsat images in characterising global forest extent. Source: https://earthenginepartners.appspot.com/science-2013-global-forest/