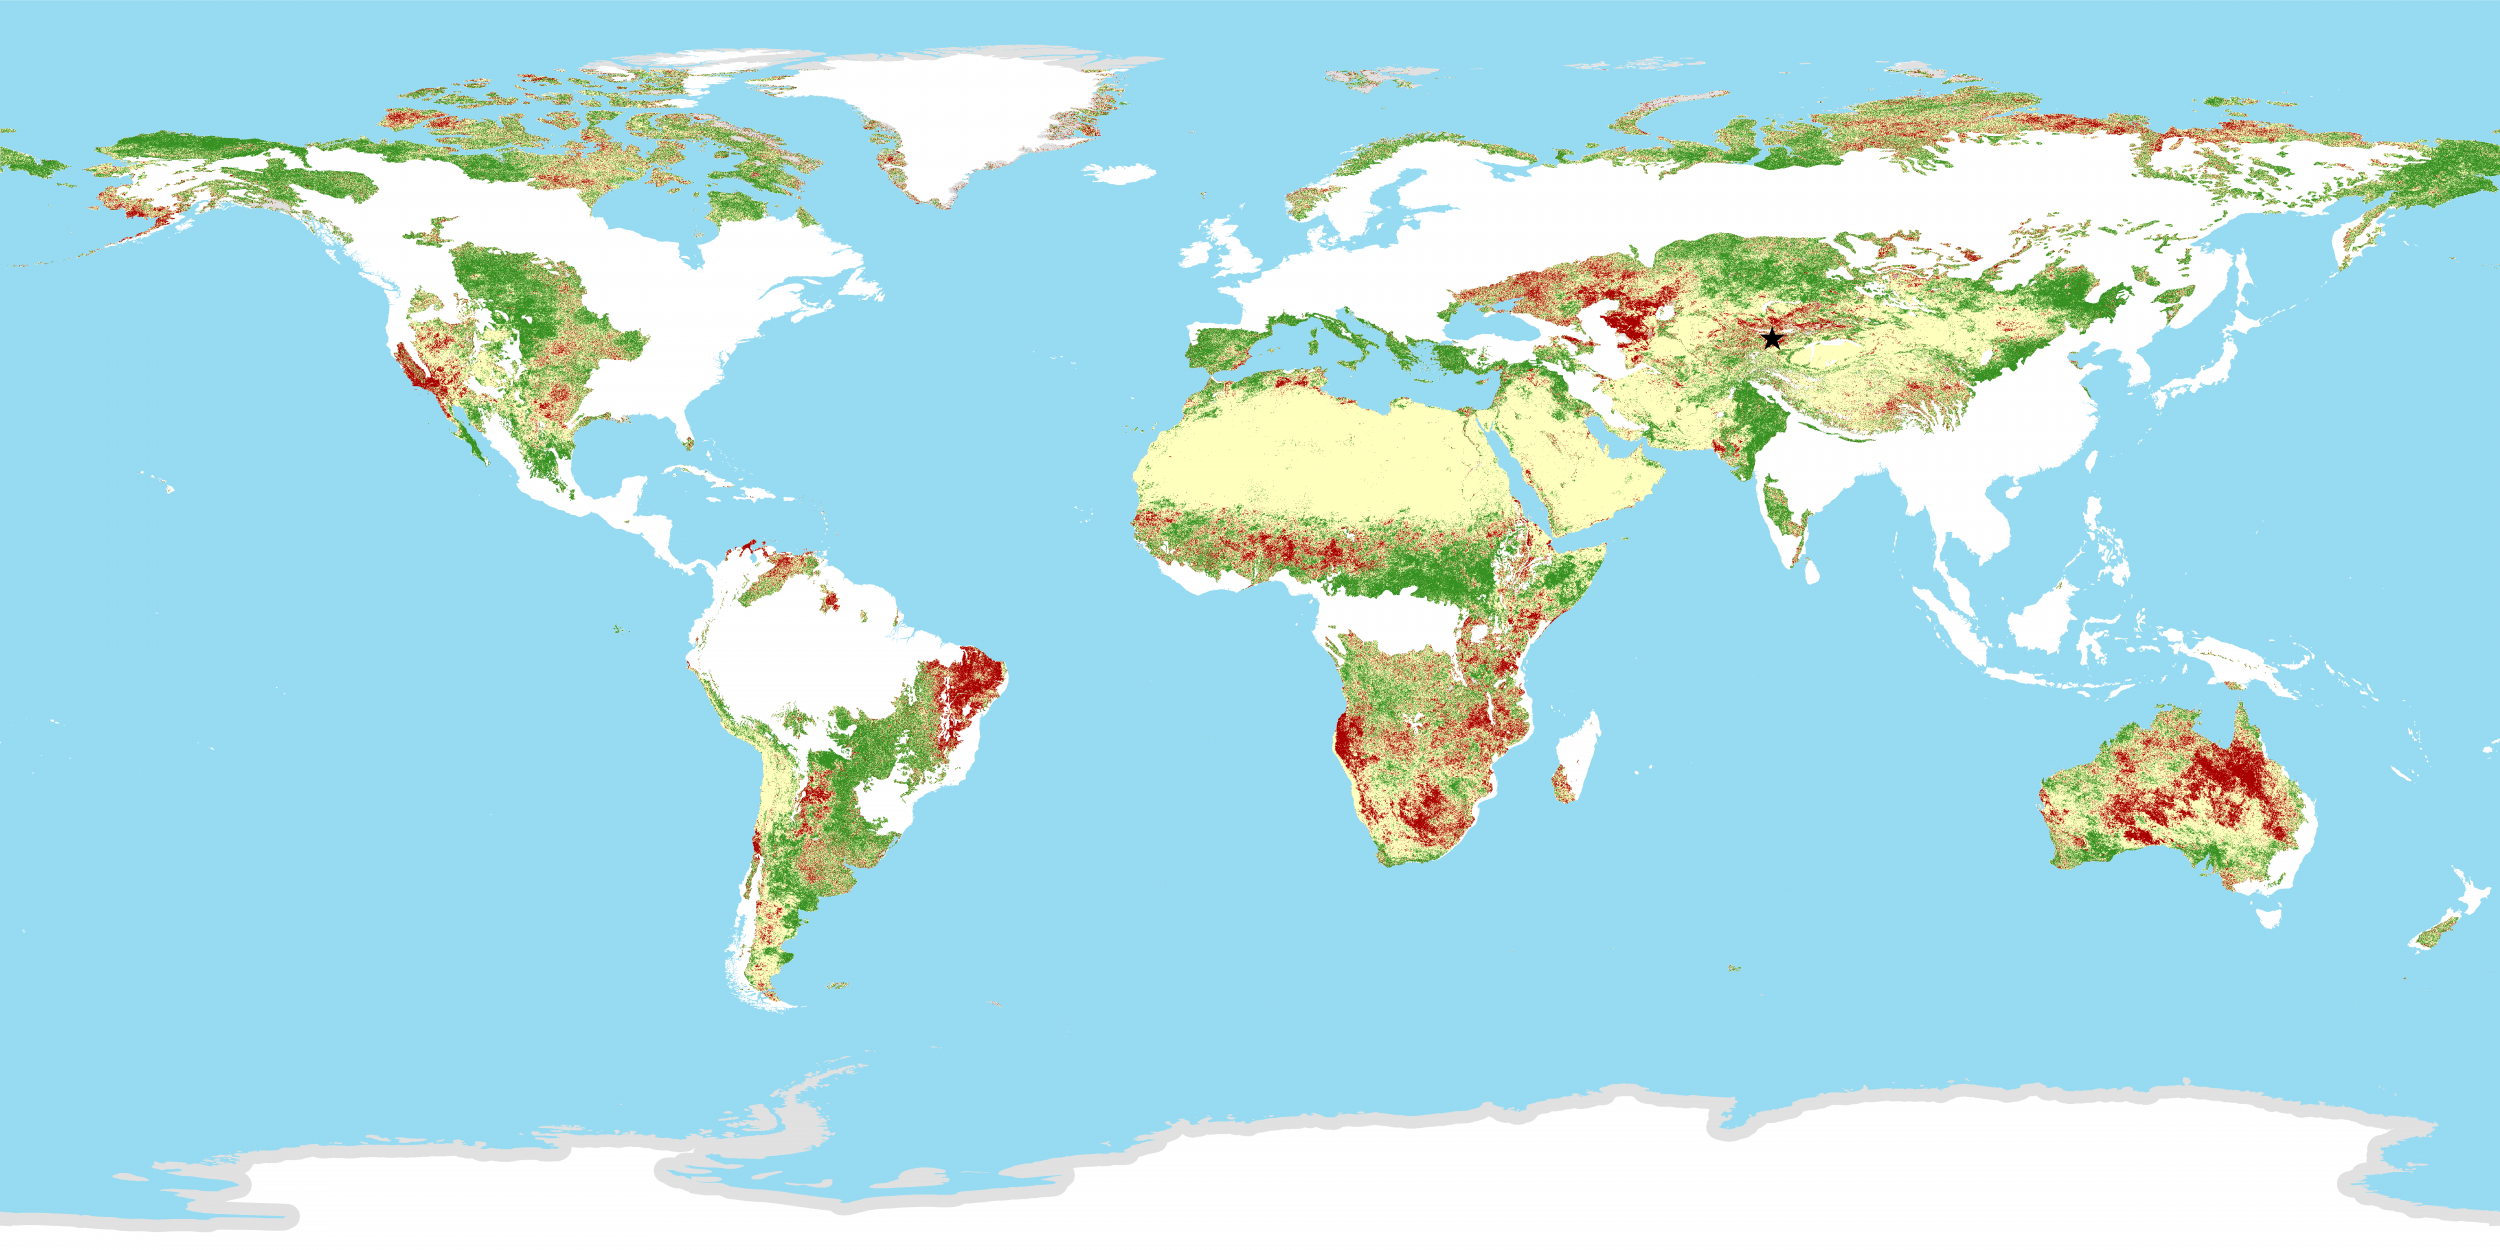
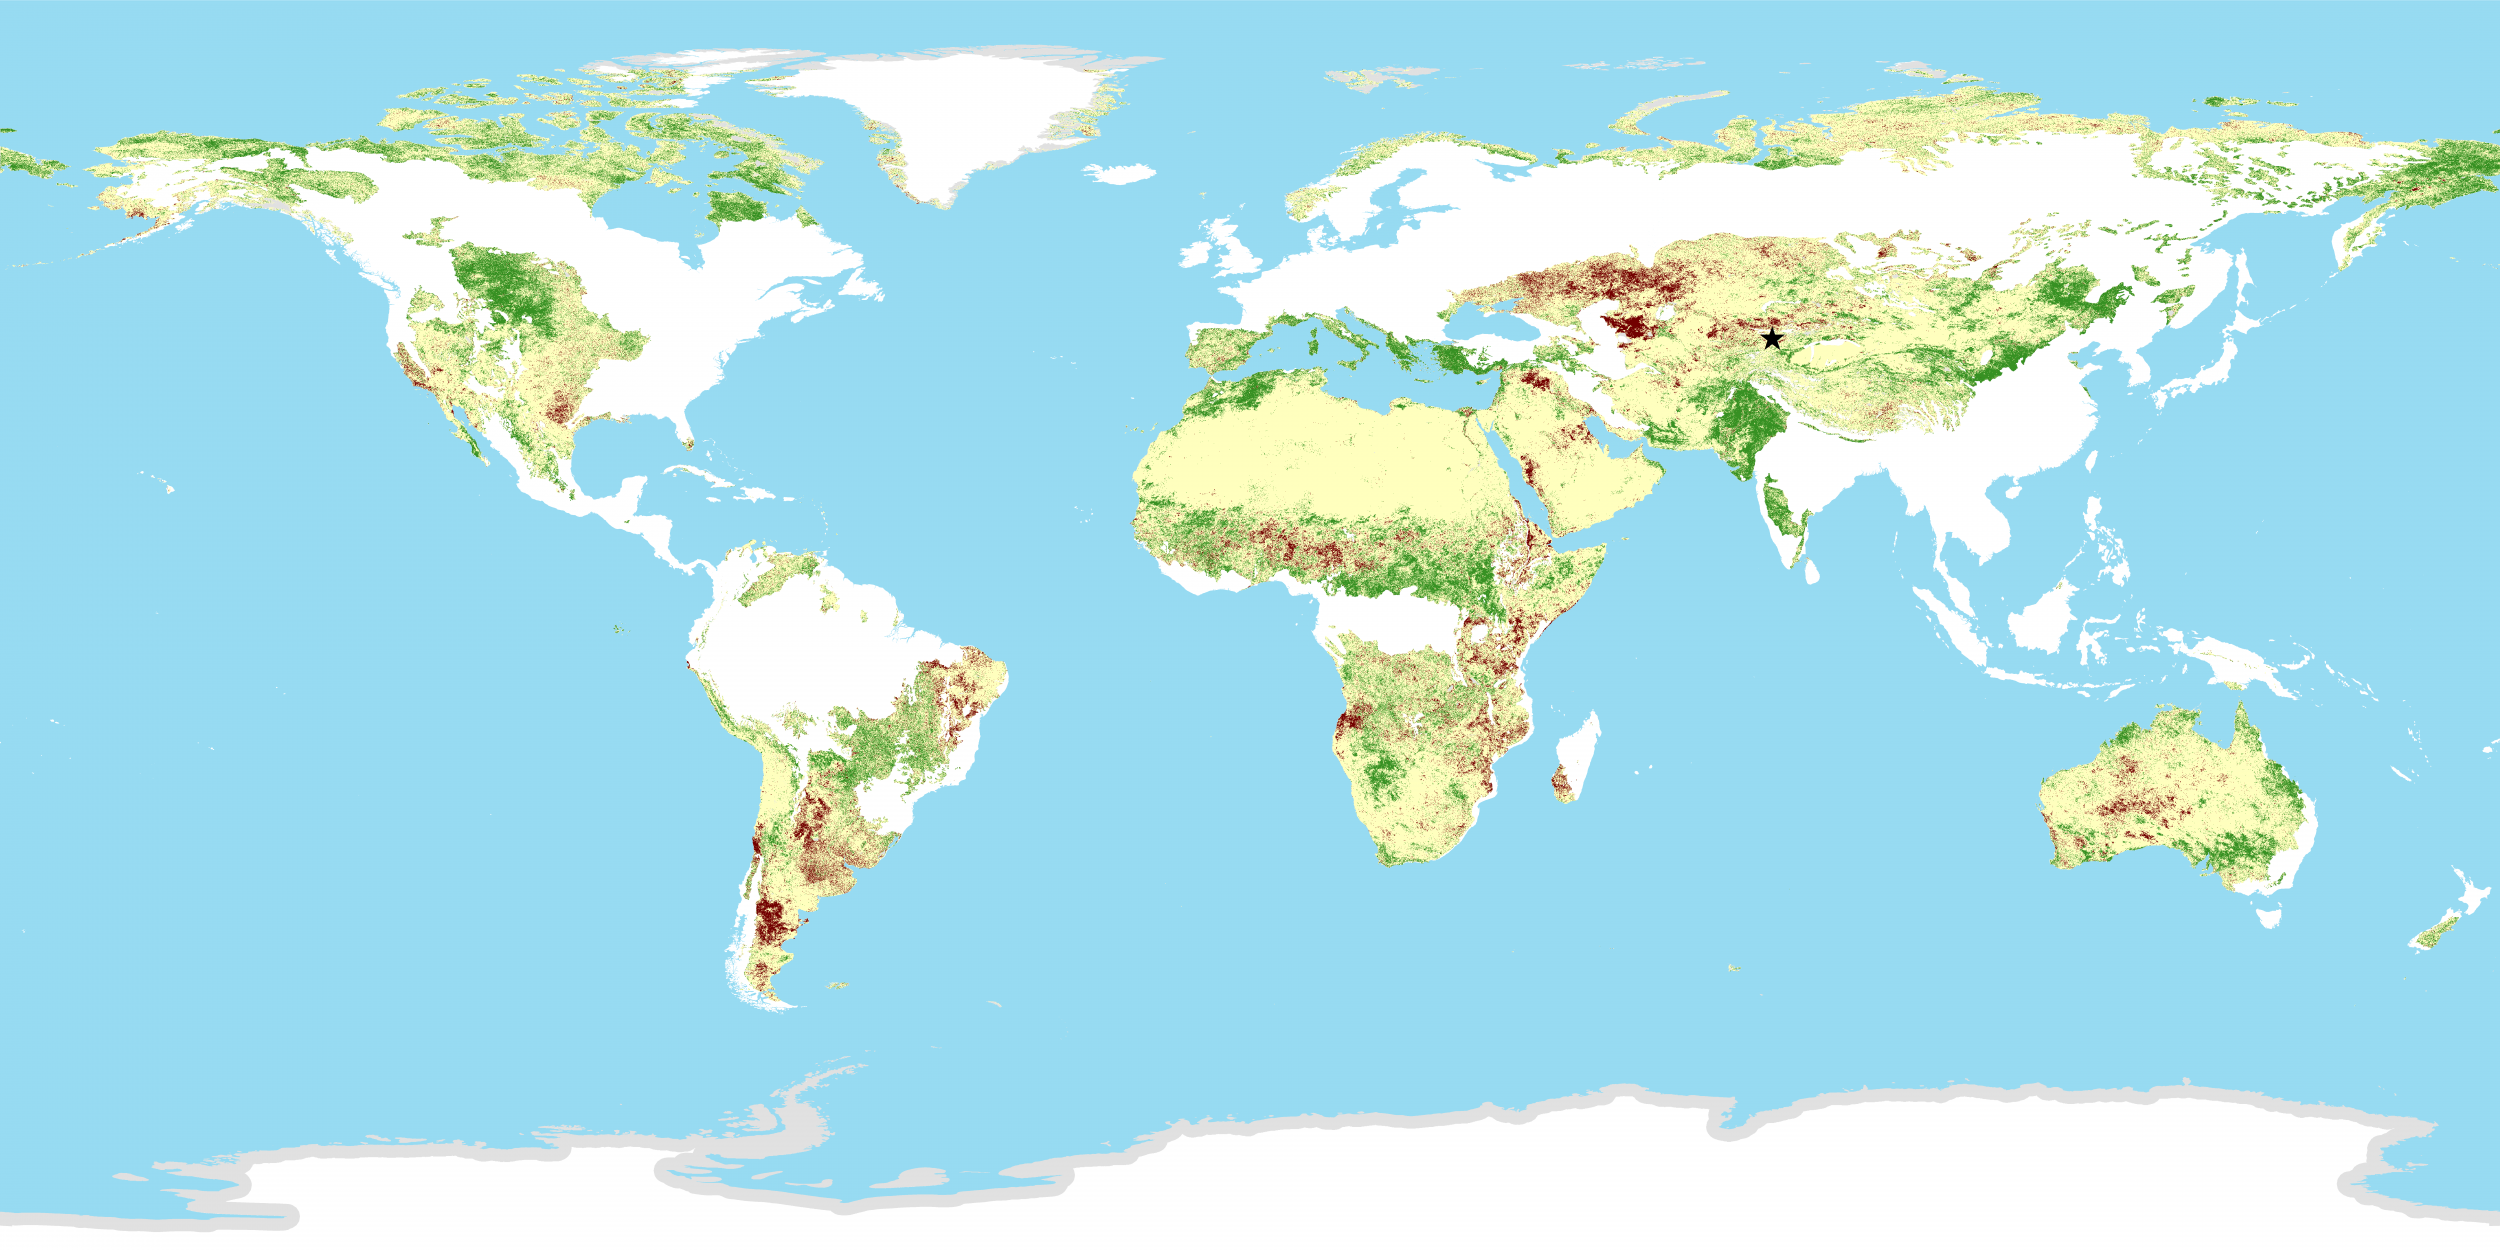
Changes in productivity of rangelands and pasture conditions in Kyrgyzstan
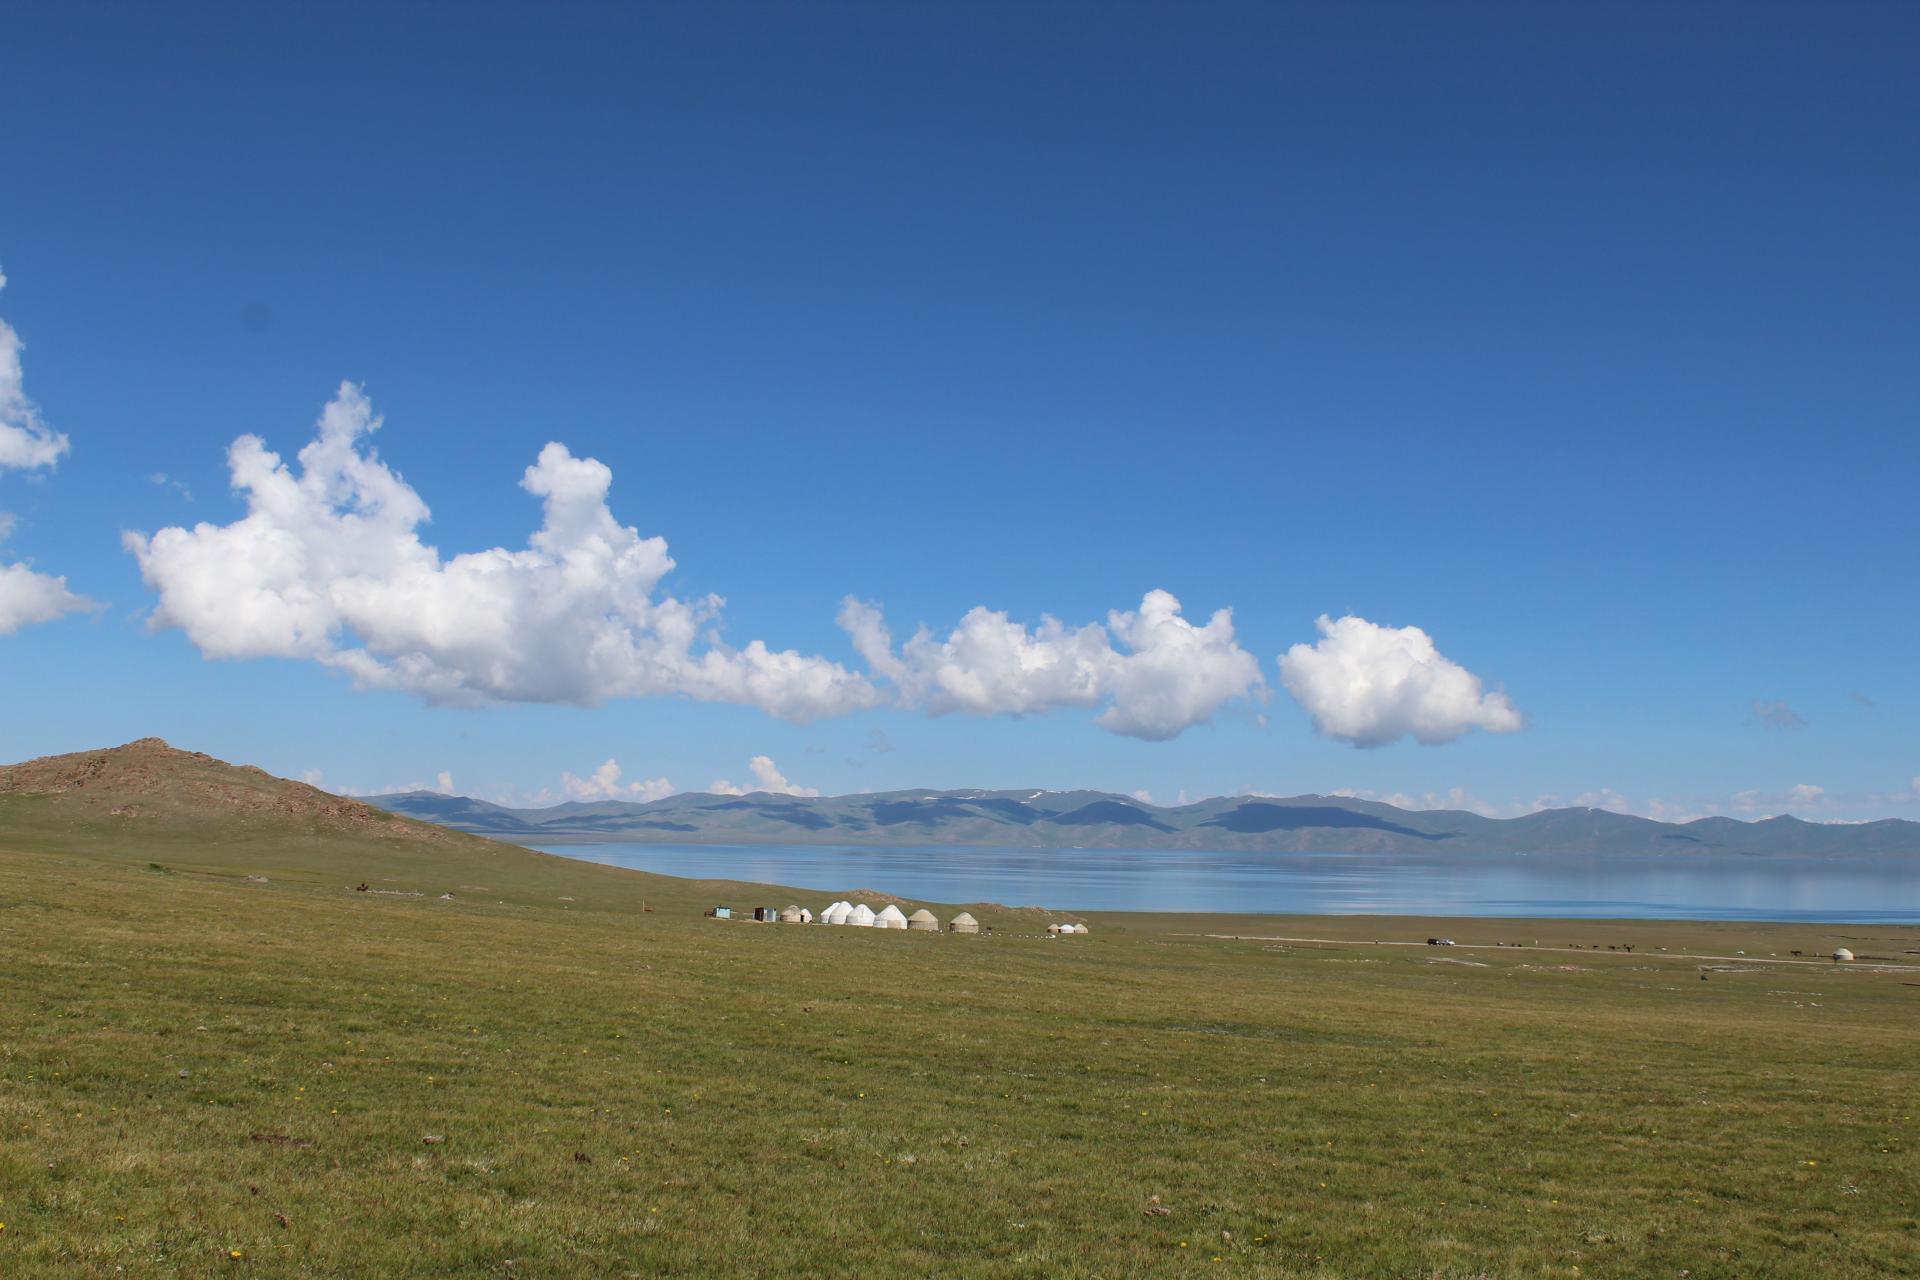
PF Camp Atloo
Kyrgyzstan land cover falls primarily under agricultural use. This total is commonly subdivided among permanent pasture land (48%) followed by arable cropping land (7%) and forestry (4%); the rest is comprised of other land cover types, mostly non-productive lands in the higher altitudes, rocky outcrops, glacial and snowfields and urban areas. About 94% of the land area sits above 1,000 m, and 40% of this is above 3,000 m. Winter pastures are located in lower altitudes, Spring-Autumn in mid-lower (transitional) altitudes, and Summer pastures in high altitude areas. Animal husbandry, through production of cattle, sheep, horse, goat, and yaks, is a key livelihood activity. However, production is facing challenges, including disregard for grazing mobility, leading to pasture degradation exacerbated by a changing climate and lack of suitable policies.
Rangeland health assessments rarely incorporate herder perspectives and data sharing remains fragmented. An assessment was carried out in Naryn oblast by FAO and Camp Alatoo, a local NGO. It integrated remote sensing, field assessment and traditional knowledge. Using Land Degradation Neutrality (LDN) indicators, it assessed degradation trends between 2000 to 2015. Local knowledge provided additional indicators to help with validation of remote sensing.
|
SDG 15.3.1 Land Degradation |
Area (km2) |
Percent of total land area |
|
Total land area |
44,897.2 |
100% |
|
Land area improved |
1,812.1 |
4.04% |
|
Land area stable |
17,525.2 |
39.03% |
|
Land area degraded |
22,294.7 |
49.66% |
|
Land area with no data |
3.265.2 |
7.27% |
The results show that vegetation related indicators, such as Normalised Difference Vegetation Index (NDVI), were the most important. In low altitude pastures, the increasing NDVI was due to arable lands. In the high-altitude pastures, remote sensing showed increasing degradation, even though bare ground is a natural occurrence in high altitudes and grassland cover rarely exceeds 80%. In the spring-autumn pastures, increasing NDVI was partly due to non-palatable species. Here, high temperatures and precipitation favour vegetation growth leading to high diversity of vegetation, including non-palatable species.
The conclusions considered that rangeland health assessment should be contingent upon the use and management objectives of the landscape. Sub-national level assessments enable identification of the main rangeland users, incorporation of local indicators (to improve quality of LDN indicators) and buy-in by local communities.
For more information: https://pragaproject.org/
Terminologies used
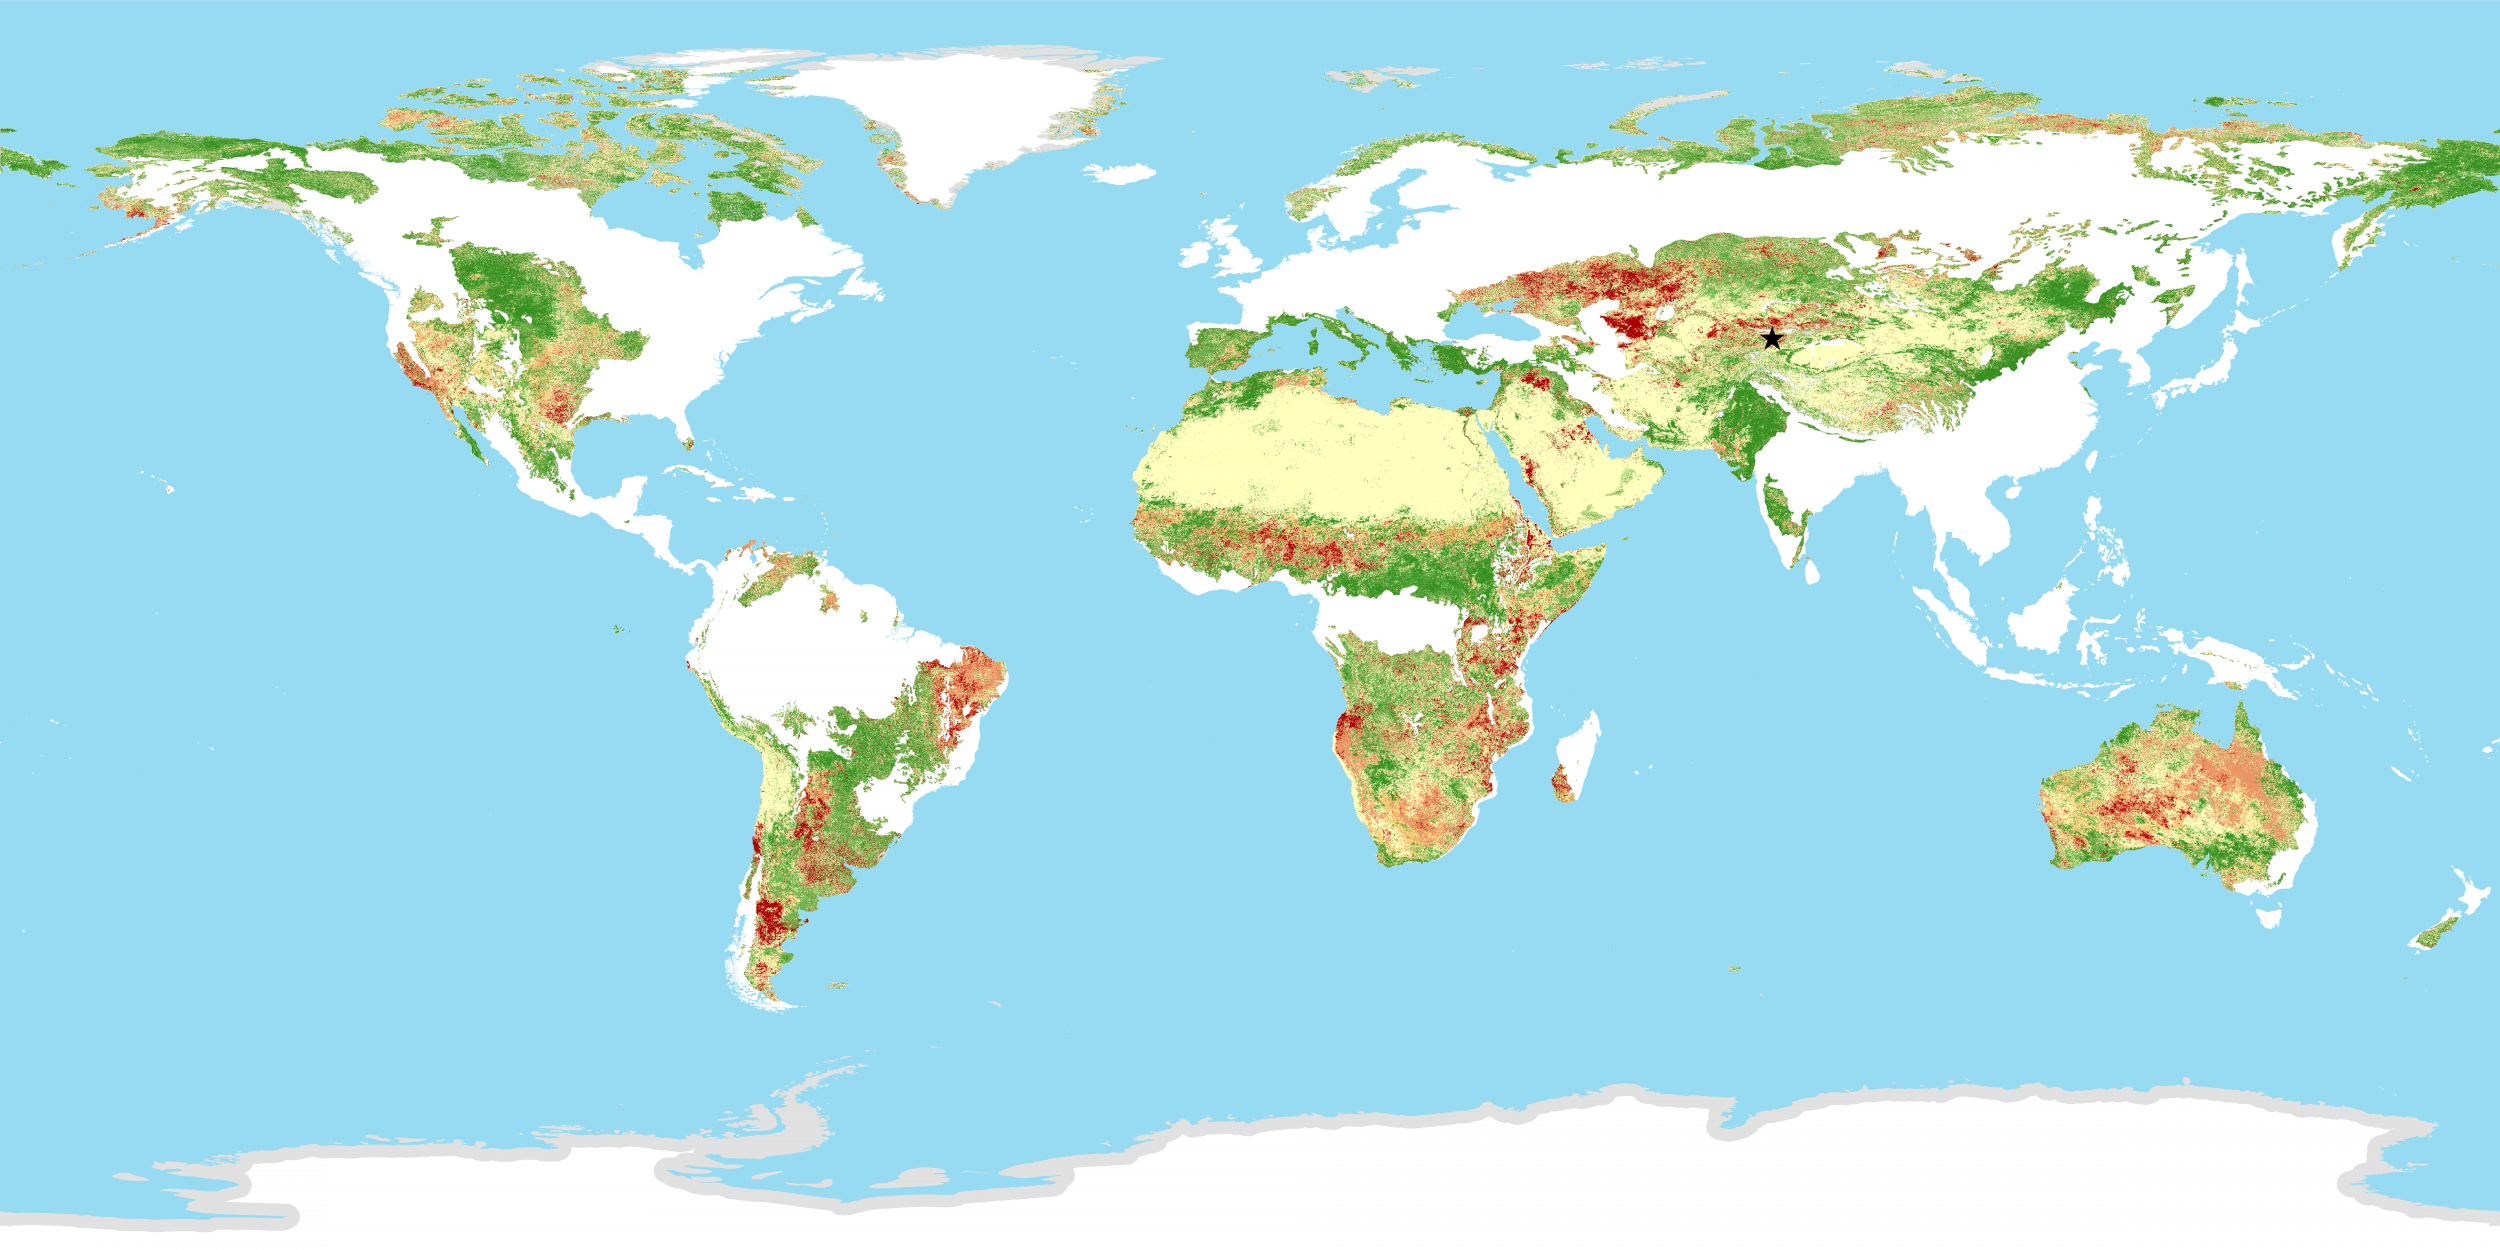
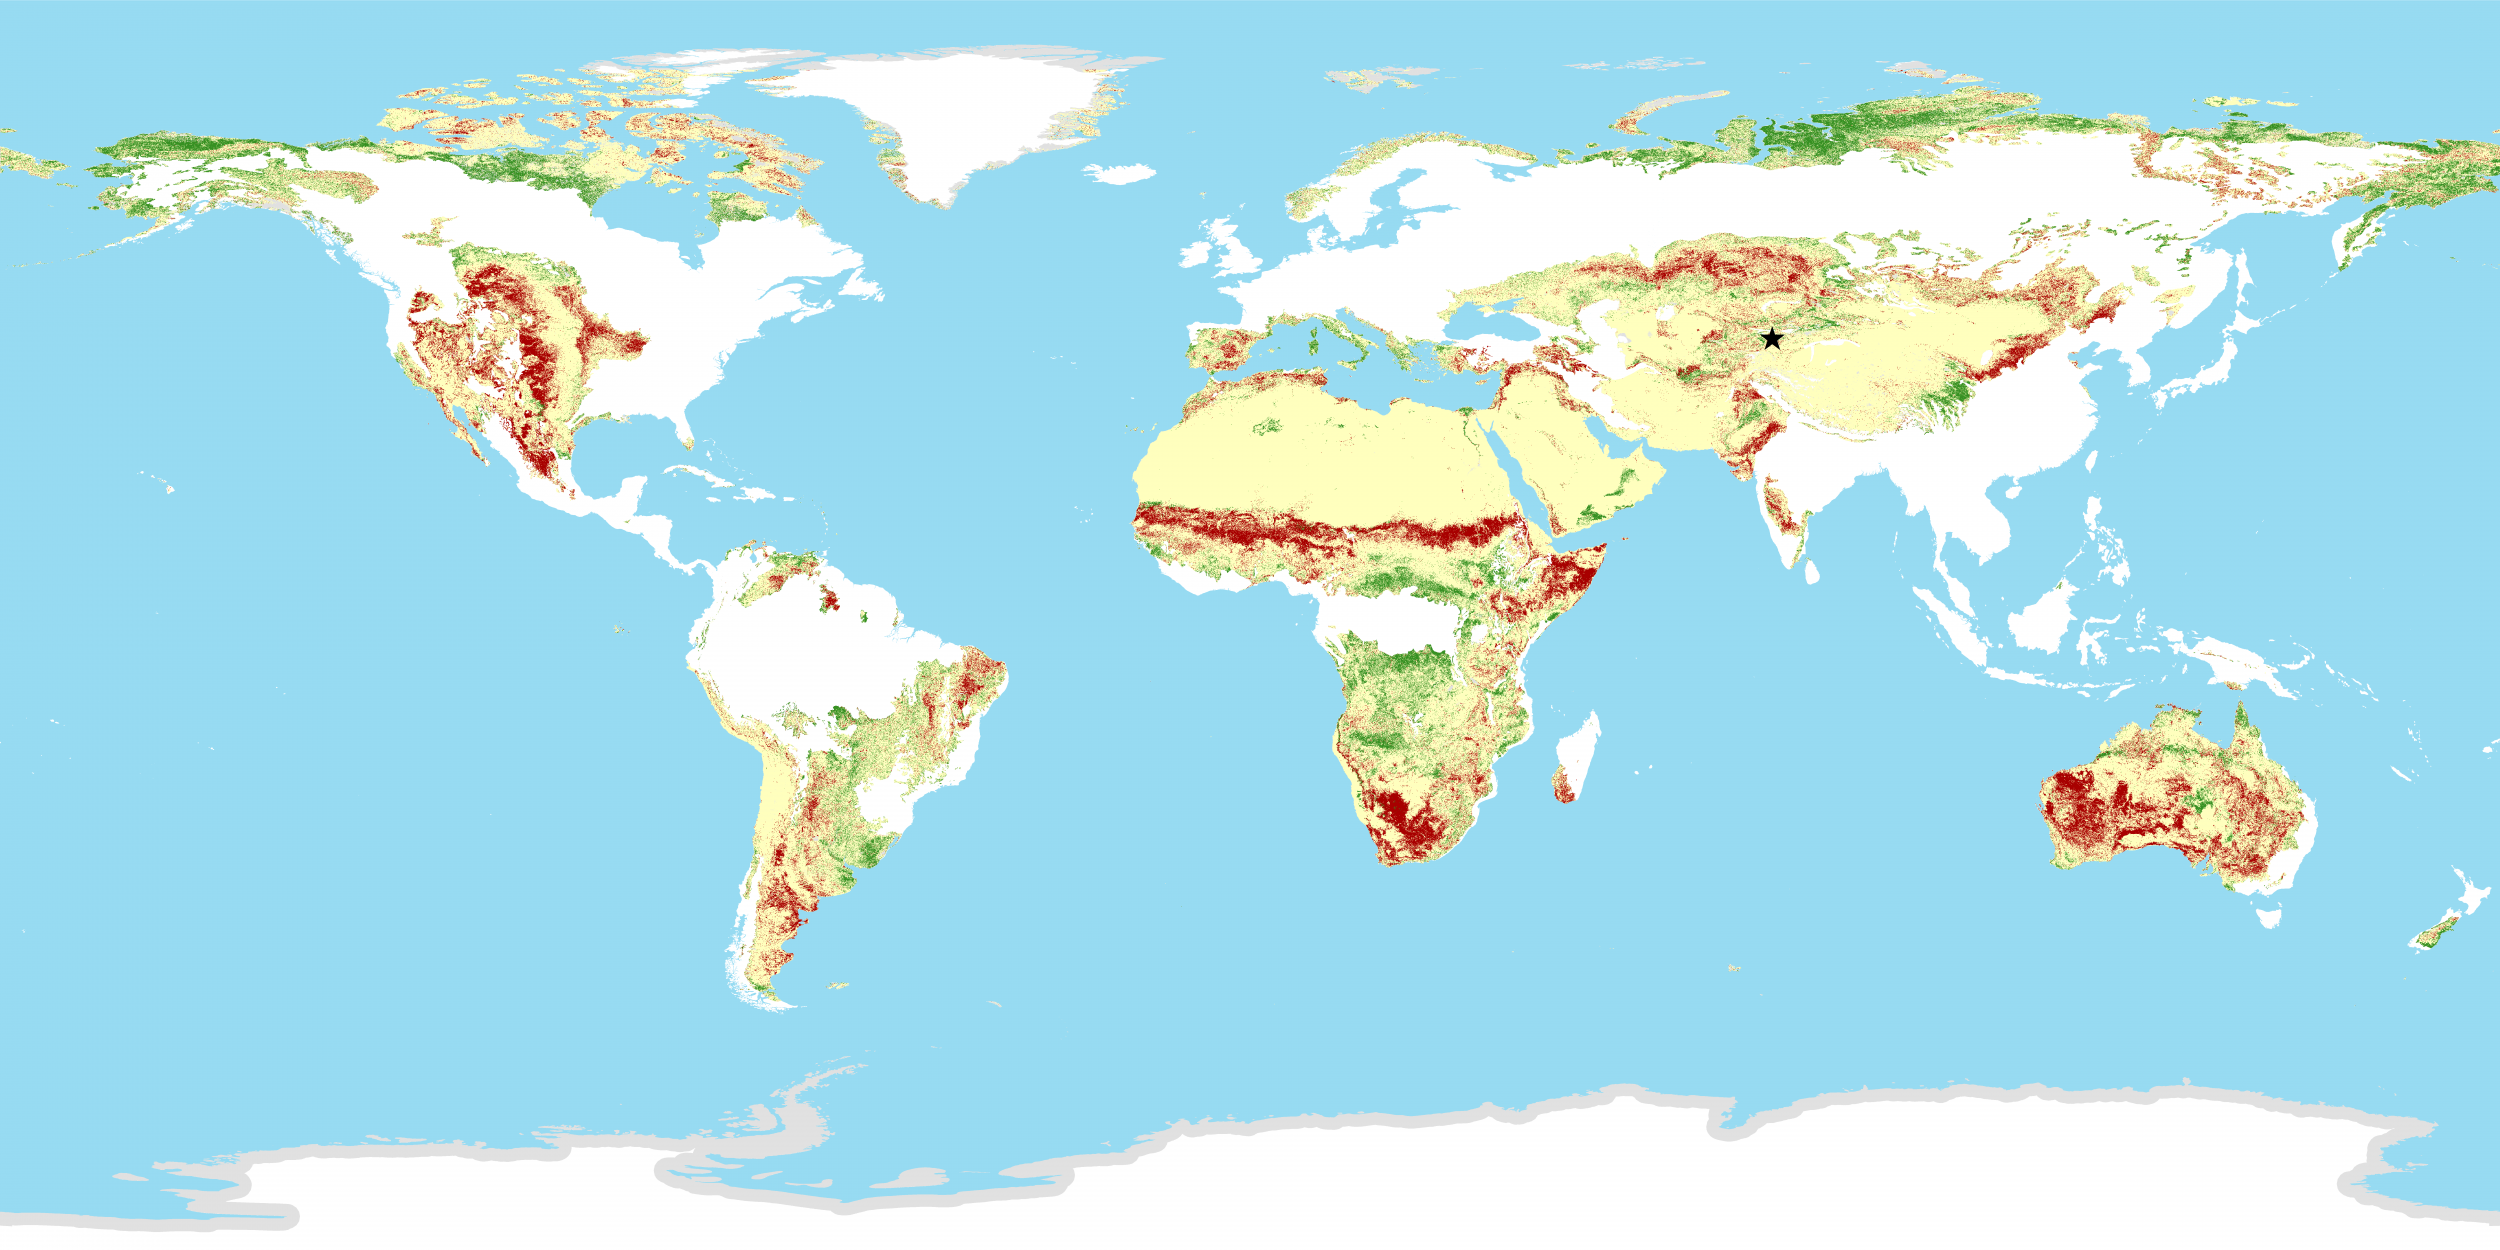
The land productivity performance indicator measures local productivity relative to other similar vegetation types in similar land cover types or bioclimatic regions. Productivity performance compares local productivity levels to the range of productivity levels measured from similar land units across the study area in the assessment year. The productivity state indicator allows for the detection of recent changes in primary productivity as compared to a baseline period. Productivity state represents the level of relative productivity in a spatial unit (pixel or feature) compared to the historical observations of productivity for that spatial unit over time. Productivity trend describes the trajectory of change in productivity over time. It is calculated by fitting a robust, non-parametric linear regression model. Trajectory measures the rate of change in primary productivity over time.